ADO.NET Connection Pool Performance Counters
I'm currently focusing on performance of my clients most used APIs. A few core services get hit a lot in their architecture, so they must be optimised for read and write, yet we are seeing some strange results from our apps when deployed. One theory could be that there are not enough connections open through to the database. We've noticed lots of task switching too in the app, could this be due to waiting for a free connection? This is a demo app to see how connections and connection pools behave on the local machine. I'll use .NET ADO SQL Performance Counters to help us.
I've written a sample app to demonstrate this. There's a JMeter runner which hits a simple controller. The controller uses the database correctly and should give us the results I want to demo.
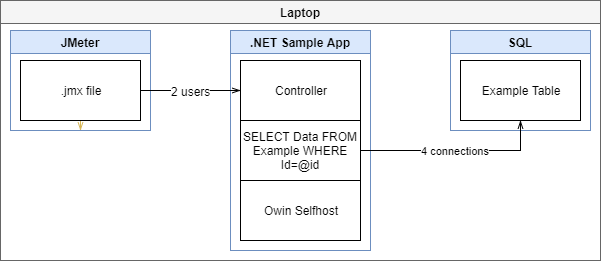
Here's the core code from the app, note that I don't have to open the connection, it's done internally inside Dapper.
public class ValuesController: ApiController {
  public async Task < IHttpActionResult > Get(string id) {
    using(var connection = new SqlConnection(ConfigurationManager.ConnectionStrings["database"].ConnectionString)) {
      // this is inefficient, just an example here
      var result = await connection.QueryAsync("SELECT [Data] FROM Example WHERE [Id]=@id", new {
        id
      });
      if (result.Count() == 0) {
        return NotFound();
      }
      return Ok(result);
    }
  }
}
Connections take resources to connect between the client and server. Keeping these connections opened and pooled lets them be shared between executions within the same process. .NET has connection pooling built into it which can be controlled via code or the connection strings.
This app performed well on my machine, with JMeter reporting sub 5 milliseconds response times with a connect time of below 1 milliseconds.
Performance Counters
If we want to see all the values, we must raise the level of performance counter detail:
<system.diagnostics>
  <switches>
    <add name="ConnectionPoolPerformanceCounterDetail" value="4" />
  </switches>
</system.diagnostics>
HardConnectsPerSecond
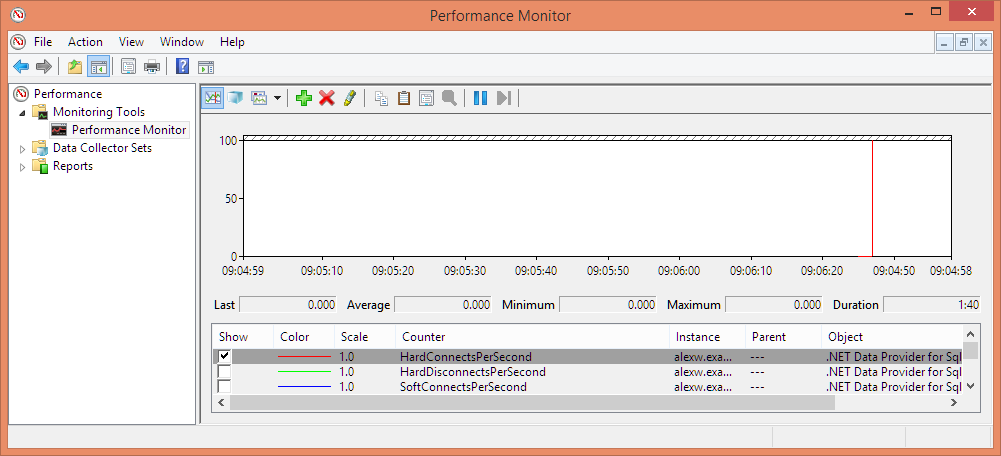
How many connections are being opened and closed explicitly each second. You would expect one connection to be opened per database, or when there aren't enough connections in the connection pool. If you see this when the app is under load after making initial connections, then your app is closing connections and you should find a way to pool them - basically don't close them.
HardDisconnectsPerSecond
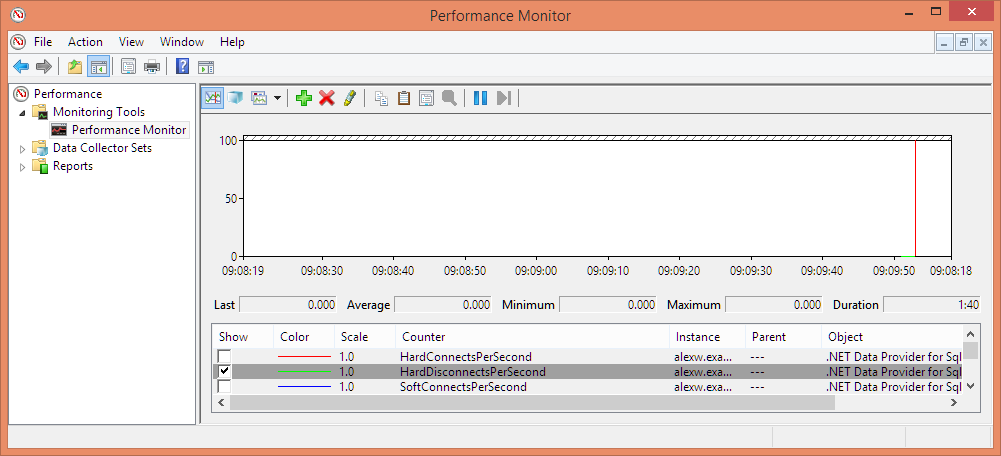
Same as HardConnectsPerSecond except this is how many times a connection is being closed. I wouldn't expect to see any values whilst the app is running under load in the majority of applications since the connections should be pooled. If you see this your app is being disconnected from the server or you're closing the connection.
SoftConnectsPerSecond
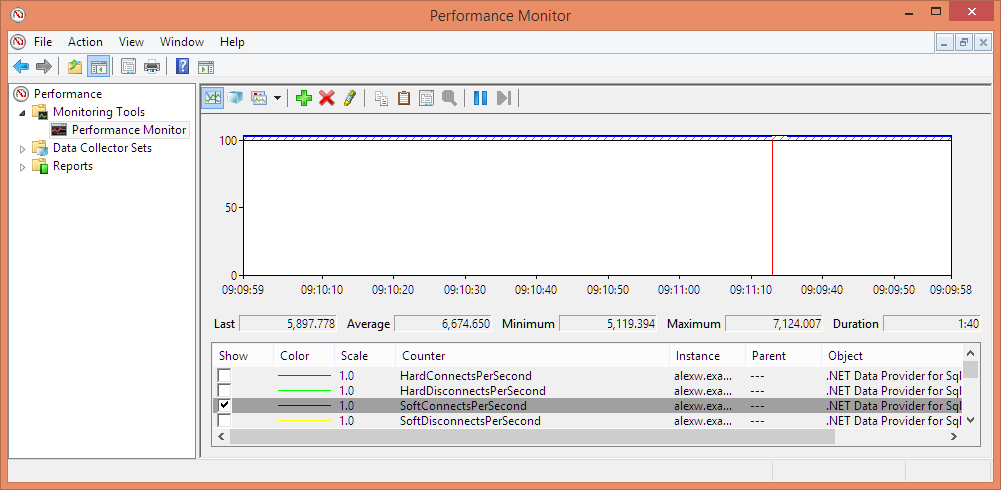
This counter shows how many connections are being opened by the application but have been intercepted by the connection pool. If there was already an unused connection pool connection open, then then open command would not open another connection, instead the connection pool would give it an open connection. If there wasn't an open connection and the connection pool is allowed to open one, you'll see the HardConnectsPerSecond counter increase. If you're calling connection.Open() anywhere (e.g., inside Dapper code, or your own ADO.NET SqlConnection using statements) then you should see soft connects. Microsoft say you should always Open() the connection but don't worry about closing it.
SoftDisconnectsPerSecond
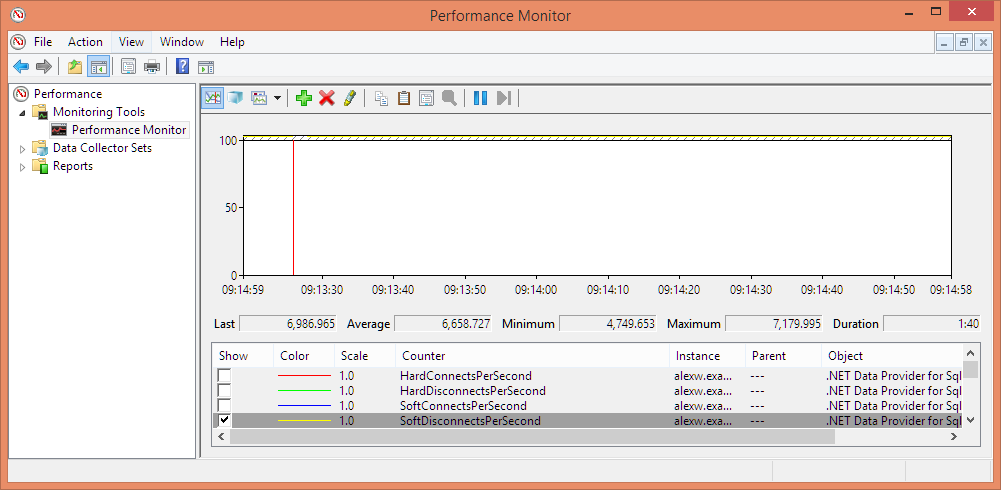
The same as above apart from this is soft disconnects. The value should be the similar or the same to SoftConnectsPerSecond. If your app is not disconnecting, then you are keeping connections open and it might lead to locking. .NET normally takes care of this for you.
NumberOfNonPooledConnections
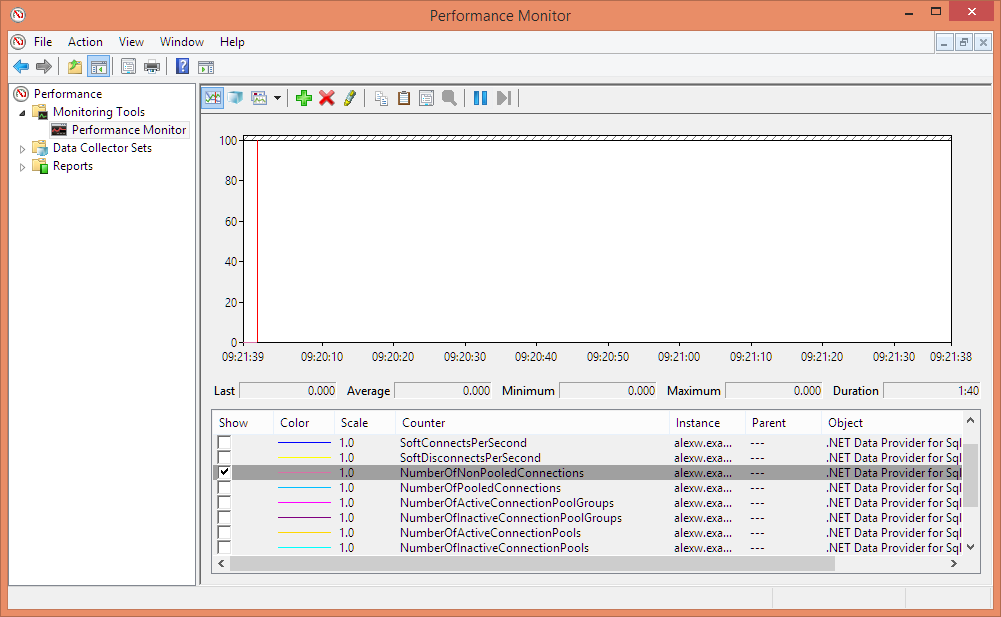
An early warning count of connections that don't take advantage of connection pooling. I'd expect this to be zero.
NumberOfPooledConnections
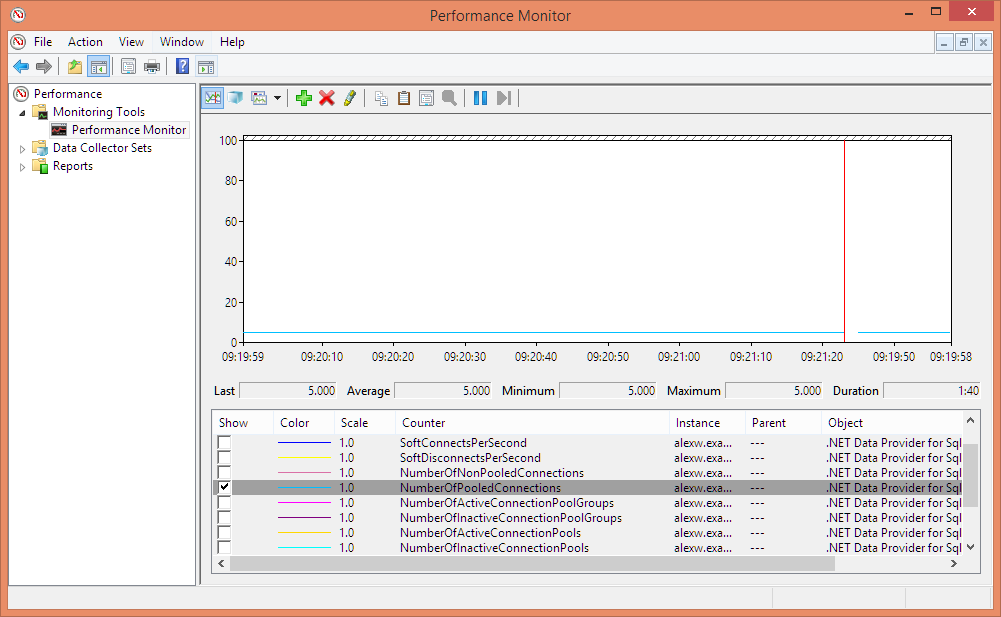
This is an important graph. It states how many connections are being used within the pools. This is a count across all the pools so may be misleading. If you're putting a lot of traffic through to your app and this value is low, then you may be being bottlenecked by the connections as the app is having to share connections in its connection pool a lot (you may see task switching in your profiling). Increase the minimum pool connection count or check your connection opening code. A value of 1 here is bad. Here under load my app with one connection pool (for my one database connection) has 5 pooled connections - they may be in an active or waiting stage, but there are 5 connected to the SQL server on my machine.
NumberOfActiveConnectionPoolGroups
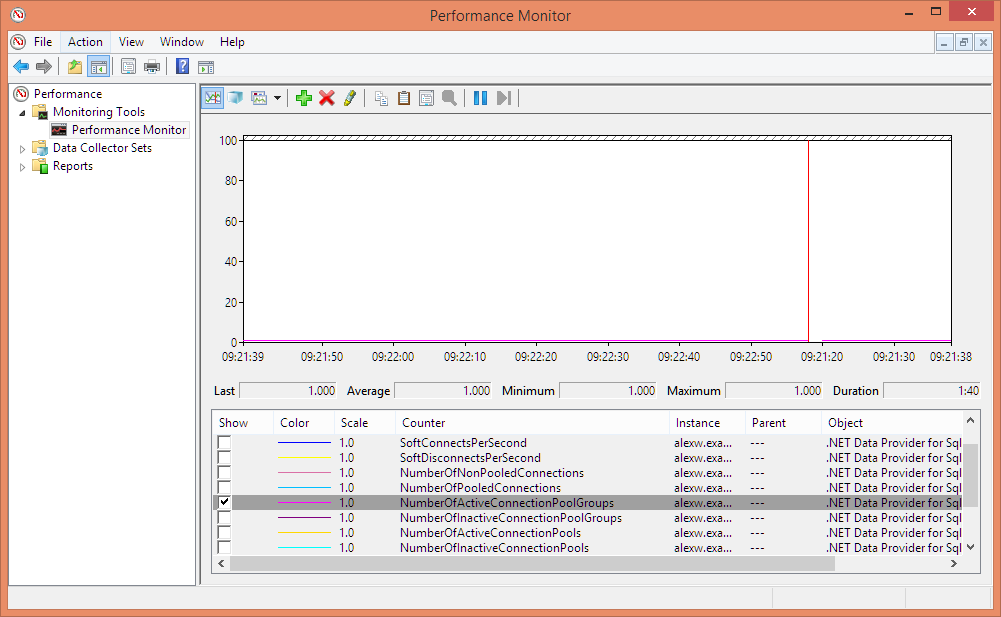
Shows the number of active connection pool groups, which is different to the number of active connection pools, there should be one per database generally. If this is zero or less than your number of different connection strings, then perhaps you're not utilising connection pooling. See NumberOfPooledConnections above.
NumberOfInactiveConnectionPoolGroups
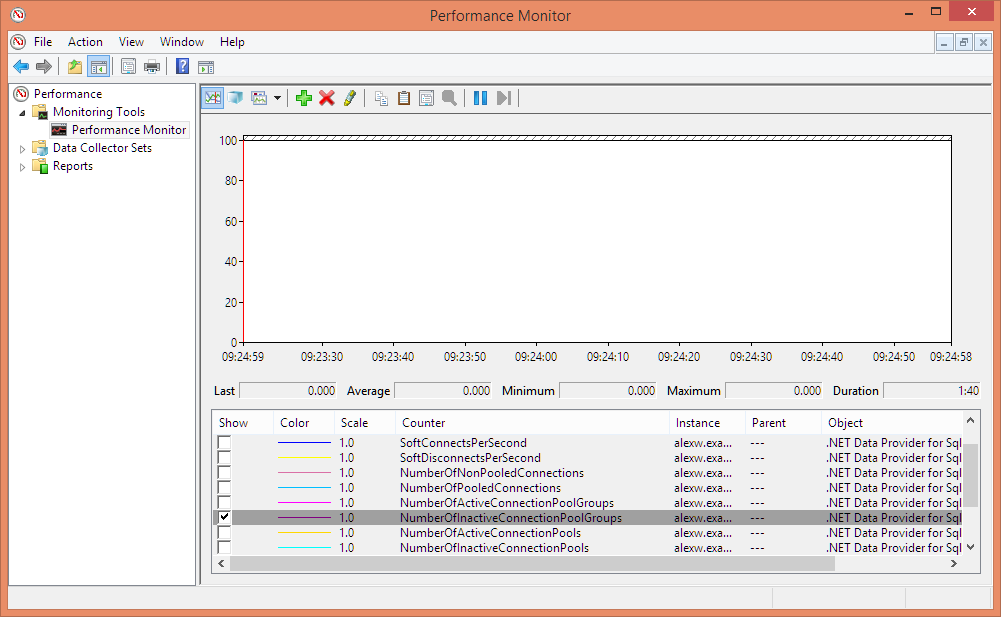
I'd expect this value to be zero unless your connections explicitly don't use connection pooling. ADO.NET uses connection pooling by default. See also NumberOfActiveConnectionPools.
NumberOfActiveConnectionPools
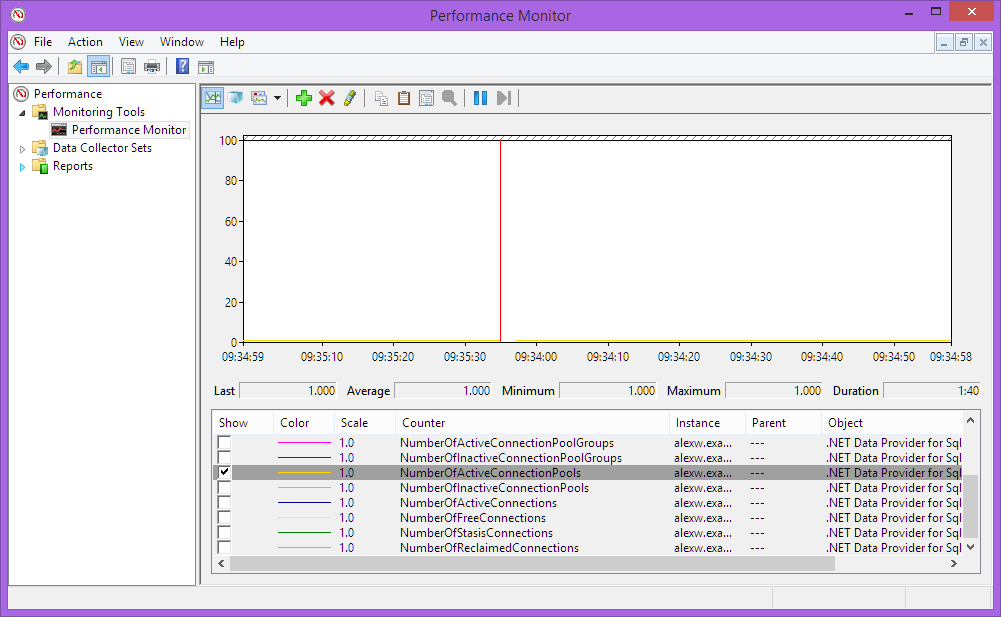
Each connection belongs to one connection pool. If you're using connection pooling then you will likely have one connection pool per database, with multiple active connections within it.
NumberOfInactiveConnectionPools
This is the number of connection pools that were created but their connections aren't currently being used.
NumberOfActiveConnections
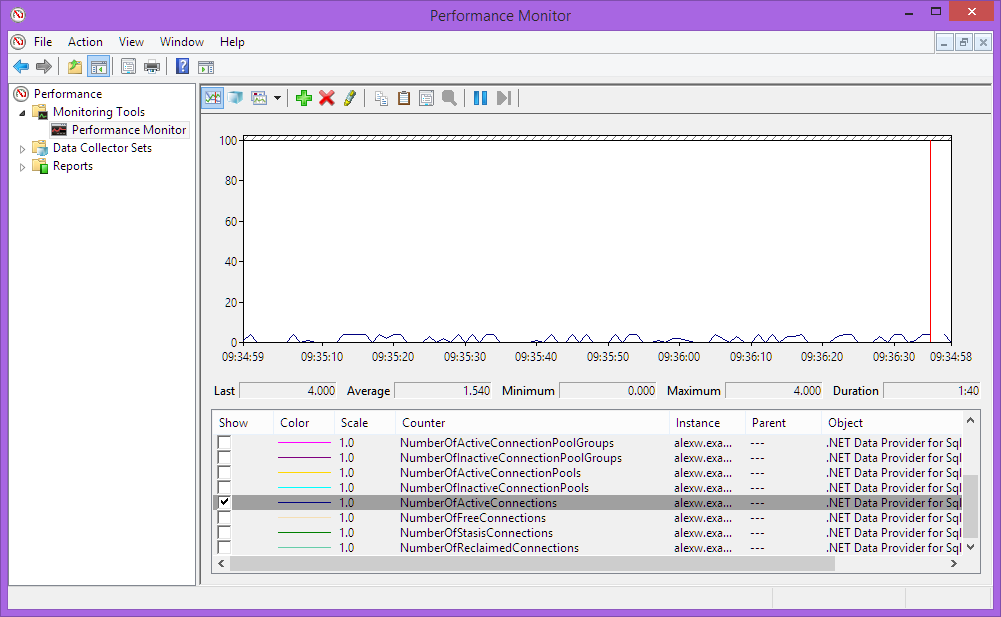
This is a good one to watch. In my example application, I saw a range of values here. The lowest I saw was 0 and the highest I saw was 4. If this is stuck at 1, you may somehow be locking your database code so only one task or thread can use it at once. When NumberOfActiveConnections increases generally the NumberOfFreeConnections decreases since they are being used up.
NumberOfFreeConnections

These are the number of open connections that are not being used. When the NumberOfFreeConnections increases, it means the connection is still alive in the pool but not currently being used by any of your code.
NumberOfStatisConnections

I've no idea what this means, and it had a value of 0 throughout. Google didn't help me either except for some Oracle documentation where it's not used - so this is probably a legacy performance counter.
NumberOfReclaimedConnections
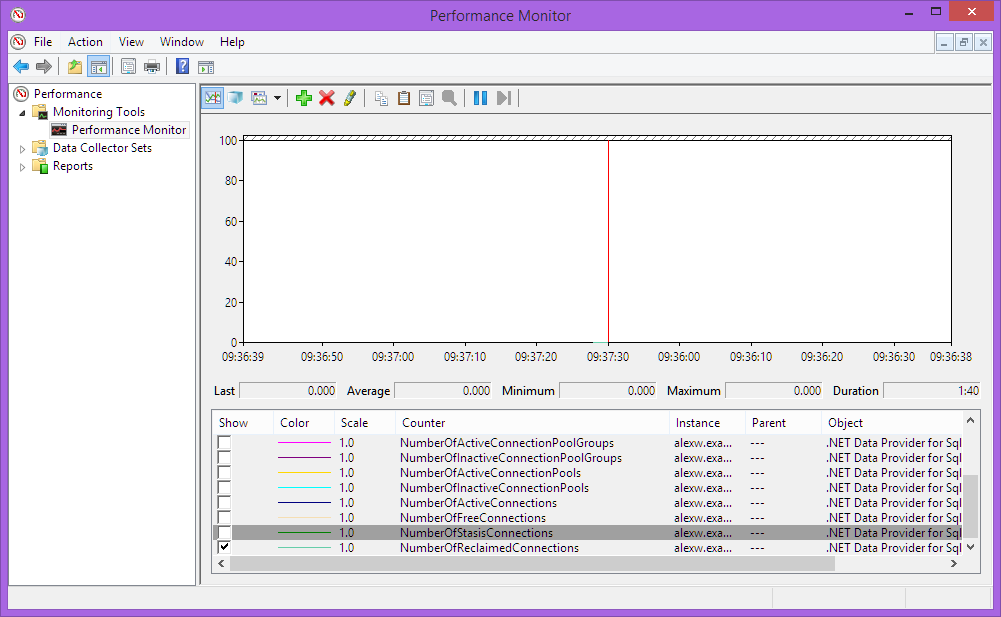
This value was always zero under load. A value here indicates .NET garbage collection released a connection, and you should have disposed or closed it in your code.
Further reading
- SQL Server Connection Pooling (ADO.NET) this is the MSDN documentation on pooling.
- Understanding and controlling ADO.NET Connections is a good resource for seeing how different settings control the number of open connection plus the effects on connection pooling and connection pool groups.