A docker-compose file for Grafana, backed by MySQL severs
I’m playing around with Grafana and MySQL and wanted a little containerised space within which I could try it out and not break anything on my local development machine.
Here’s a docker-compose solution for single Grafana instance with a MySQL instance for its settings, plus an additional MySQL stats database for values I can use for data. Grafana supports multiple connections including Prometheus, CloudWatch, and MySQL etc.
At Rest Less we run our own clustered Grafana and it’s pretty awesome. We’ve connected it to CloudWatch and we’re able to get near-realtime stats without having to do much. We push stats directly to CloudWatch from our lambdas and infrastructure, plus also via StatsD configured CloudWatch on our more traditional EC2 servers. We then setup Grafana behind a loadbalancer to point to the data sources like CloudWatch, with all the configuration stored in a multi-AZ database so we’ve got redundancy for very little work.
version: "3.9"
services:
  grafana:
    links:
      - grafana_db:grafana_db
    image: grafana/grafana:7.5.4
    volumes:
      - ./grafana:/var/lib/grafana:rw
    environment:
      - GF_DATABASE_HOST=grafana_db:3306
      - GF_DATABASE_NAME=grafana
      - GF_DATABASE_USER=grafana
      - GF_DATABASE_PASSWORD=password
      - GF_DATABASE_TYPE=mysql
      - GF_DATABASE_MAX_OPEN_CONN=300
    ports:
      - "3000:3000"
    depends_on: ["grafana_db"]
  grafana_db:
    image: mysql:5.6
    environment:
      MYSQL_ROOT_PASSWORD: rootpass
      MYSQL_DATABASE: grafana
      MYSQL_USER: grafana
      MYSQL_PASSWORD: password
    command:
      [
        mysqld,
        --character-set-server=utf8mb4,
        --collation-server=utf8mb4_unicode_ci,
        --innodb_monitor_enable=all,
        --max-connections=1001,
      ]
    ports:
      - 3306:3306
    healthcheck:
      test: ["CMD", "mysqladmin", "ping", "-h", "localhost"]
      timeout: 10s
      retries: 10
  stats_db:
    image: mysql:5.6
    environment:
      MYSQL_ROOT_PASSWORD: rootpass
      MYSQL_DATABASE: stats
      MYSQL_USER: stats
      MYSQL_PASSWORD: password
    command:
      [
        mysqld,
        --character-set-server=utf8mb4,
        --collation-server=utf8mb4_unicode_ci,
        --innodb_monitor_enable=all,
        --max-connections=1001,
      ]
    ports:
      - 3307:3306
    healthcheck:
      test: ["CMD", "mysqladmin", "ping", "-h", "localhost"]
      timeout: 10s
      retries: 10
So far this works well on my Windows 10 machine using Docker for WSL2.
Usage
Run docker-compose up. The containers defined in the docker-compose file will run. You can check they’re running by running docker ps and looking at the names of the containers.
To stop them, press Ctrl+C in your terminal or run docker-compose down.
Connecting to the servers
In this example because I’ve hard-coded the ports using the ports: command:
ports:
  - 3306:3306
They are exposed on your local machine as the value on the left of the colon :. In production you probably don’t have the luxury of being able to do that, so you’ll use dynamically generated ports.
Docker containers have their own namespaced internal networking and route, and you can see a hint of that with the grafana database connection environment variable using the grafana_db hostname:
- GF_DATABASE_HOST=grafana_db:3306
which in this case is using port 3306 internally. If you don’t use the port:port mapping, the port on your development machine/host will use a dynamic port and map it to 3306 on the docker container. If you ever want to find out what those mappings are, you can run docker ps and look at the PORTS column.
You’ll see something like this with the docker-compose above when you run docker ps:
CONTAINER ID   IMAGE                   COMMAND                  CREATED          STATUS                    PORTS                              NAMES
5868b21a3ddf   grafana/grafana:7.5.4   "/run.sh"                26 minutes ago   Up 19 minutes             0.0.0.0:3000->3000/tcp             monitoring_grafana_1
376cfd8f70f7   mysql:5.6               "docker-entrypoint.s…"   26 minutes ago   Up 19 minutes (healthy)   0.0.0.0:3307->3306/tcp             monitoring_stats_db_1
785cf68d9ea4   mysql:5.6               "docker-entrypoint.s…"   26 minutes ago   Up 19 minutes (healthy)   3306/tcp, 0.0.0.0:3306->3006/tcp   monitoring_grafana_db_1
And you’ll see this if you change the ports from [host port]:[container port] (e.g., 3307:3306) to just [container port] like 3306) - check the PORTS column again:
CONTAINER ID   IMAGE                   COMMAND                  CREATED          STATUS                             PORTS                     NAMES
f0039bd98325   grafana/grafana:7.5.4   "/run.sh"                53 seconds ago   Up 9 seconds                       0.0.0.0:3000->3000/tcp    monitoring_grafana_1
a9963e2e8a4a   mysql:5.6               "docker-entrypoint.s…"   53 seconds ago   Up 10 seconds (health: starting)   0.0.0.0:49202->3306/tcp   monitoring_stats_db_1
a02e8282bc7a   mysql:5.6               "docker-entrypoint.s…"   53 seconds ago   Up 10 seconds (health: starting)   0.0.0.0:49201->3306/tcp   monitoring_grafana_db_1
In this table you can see the mappings in the PORTS column. For the stats db, you can connect from your local machine via MySQL workbench or your editor of choice with hostname 127.0.0.1 and port 49202.
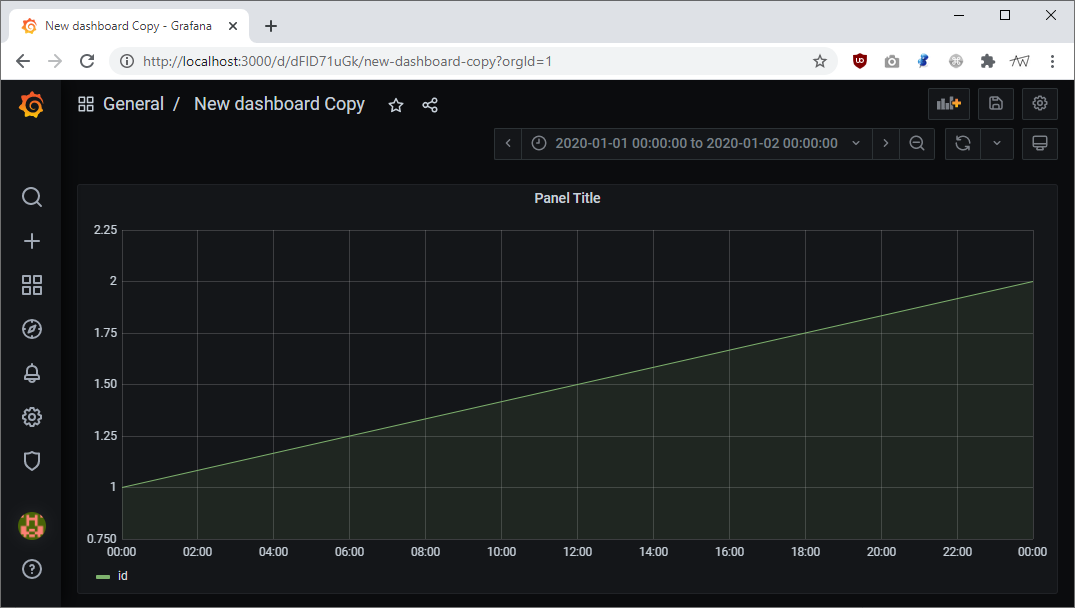
I didn’t alter the grafana ports section in this example so you can still connect to the Grafana login page at https://127.0.0.1:3000.
Hope this helps someone!
Edit: 2023-05-22 3306 Typo fix - suggested by Eric Thirolle